Prodotti
NAVOO Digital Guide
La tua struttura
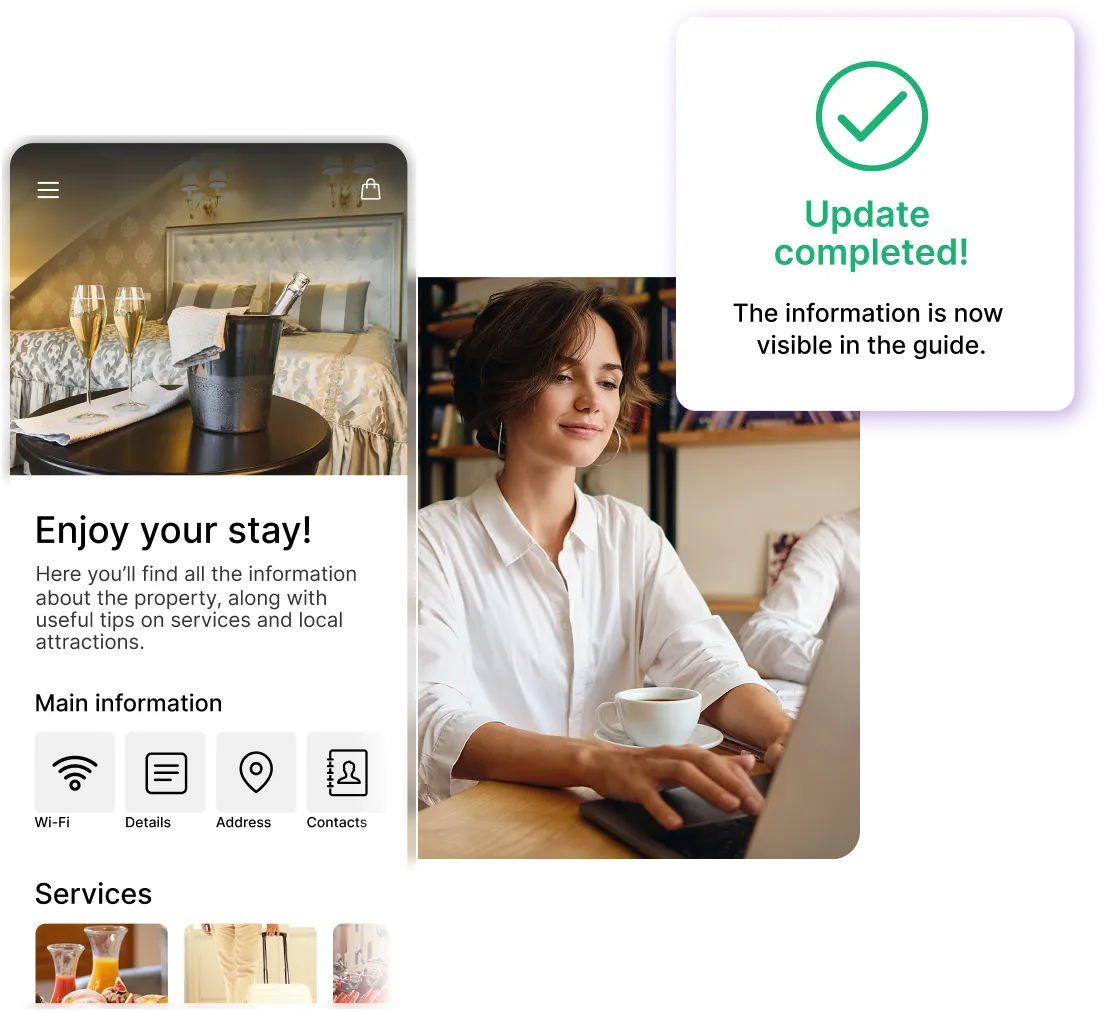
Do you know what your guests are looking for during their stay?
With the NAVOO Digital Guide, you have access to clear, up-to-date usage statistics: find out what information your guests view most often and where you can improve their experience.
What you can learn with NAVOO Digital Guide
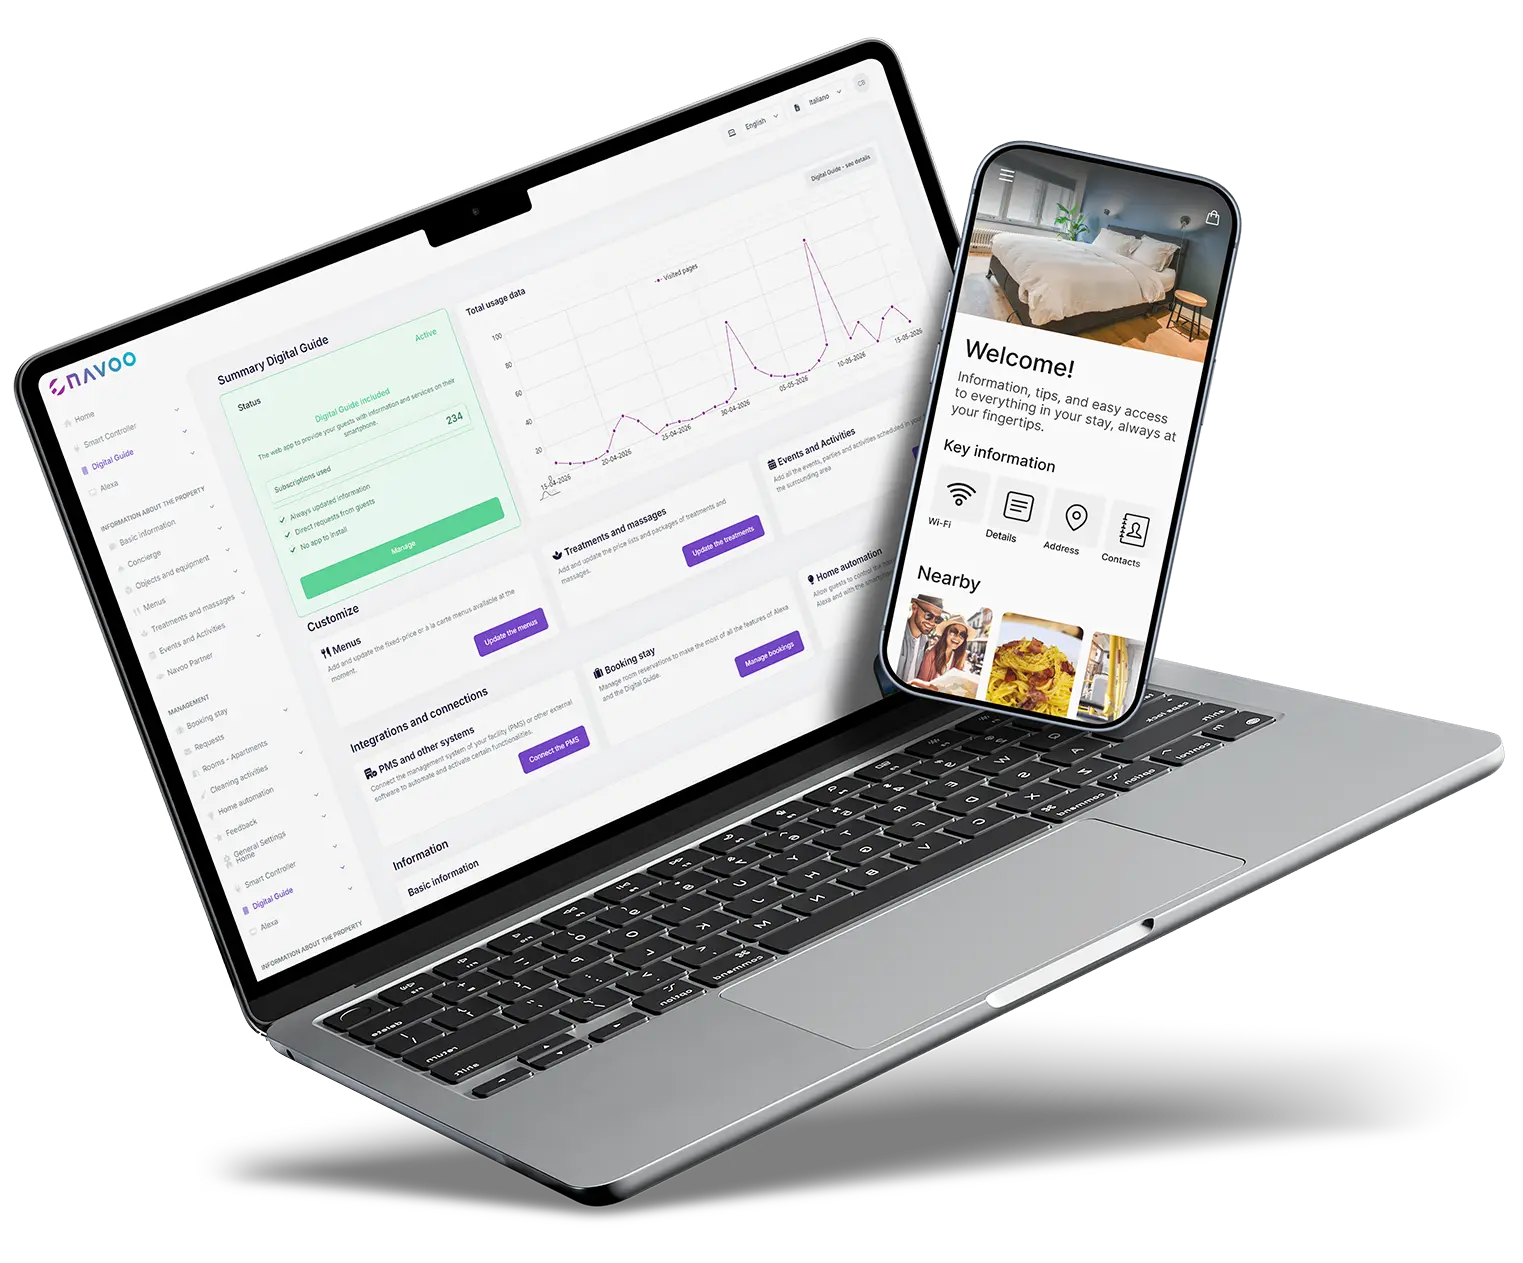
More than just a guest guide: from the NAVOO Console, you always have a clear overview of how guests use the guide.
Can you tell if the guide is being used?
See right away whether guests open the guide and how many times. You’ll know whether what you offer is actually being used.
Find out what guests are looking for
See which content gets the most views: Wi-Fi, check-out, rules, services. You’ll know exactly what they’re looking for.
Measure how many requests are handled
Every request that comes through the guide means one less call. See how many requests the guide handles for you.
Get to know your guests better
See which languages guests use to browse the guide. This helps you understand whether to add or improve content in a specific language.
Statistics help you understand what guests are really looking for during their stay
Understanding how the guide is used allows you to improve it over time: update the right content, address concerns before they arise, and make each stay more self-guided than the last.
From the NAVOO Console, you have access to up-to-date charts and data that are easy to read, with no technical expertise required. You can see which sections are viewed most often, where visitors spend the most time, and where you can take action to improve.
For you, this means decisions based on real data, not gut feelings. For your guests, this means an increasingly useful guide.
Do you have any questions?
What data can I see in the statistics?
You can see how many times the guide is opened, how many browsing sessions are generated, which pages receive the most visits, and how many interactions each module receives. Data on visitors’ languages is also available.
Can I see which information is searched for most often?
Yes. The “Pages Visited” section of the console shows the name and number of views for each piece of content in the guide, so you can see what visitors are actually looking for and where you can improve.
Is the data always up to date?
Yes. The statistics are updated automatically and can always be viewed from the console. You can filter by search period and refresh the data whenever you want.
Are the charts hard to read?
No. The data is presented in clear charts and tables that are easy to understand even without technical expertise. You can switch from the hourly view to the daily view with a single click.
Why is it helpful to monitor the use of the guide?
Because it allows you to improve the content based on what’s actually happening, reduce repetitive messages, and make the guide more effective for guests and staff.
Still have doubts? Write to us and we will help you.
Try the free demo and discover how information, services and statistics can help you manage your guests’ experience better.
- Instant access from your smartphone
- No accounts and no installations
- Demo ready with one tap or via QR code